
The engine behind your decision-making.
Istanbul Data Vantage is more than a reporting tool. It is a high-performance visualization suite designed to turn high-velocity **metrics** into strategic clarity. We’ve stripped away the noise to focus on what matters: low-latency data rendering and intuitive **KPI** tracking.
Engineered for Clarity
Most platforms fail because they overwhelm the user. Our design philosophy centers on "progressive disclosure"—showing you exactly what you need, exactly when the **analytics** demand action.
Dynamic Aggregation
Our proprietary processing layer aggregates raw data from disparate sources (CRMs, ERPs, and APIs) into a unified stream. This ensures every **KPI** is calculated against the same source of truth in real-time.
Custom Canvas
Users can define "Focal Points"—dedicated widgets that priority-rank anomalies. Instead of searching for errors, the interface highlights them using color-coded urgency indicators.
Technical Core
Built on a React-based front-end with a Rust-powered data pipeline for sub-second latency.
Interoperability
Standardized JSON output allowing for seamless integration with existing business intelligence stacks.
Inside the Stack
A technical deep dive into how we handle the complexity of modern business **metrics** without sacrificing speed.
Average Query Time
"While legacy systems take minutes to refresh across global regions, Vantage delivers localized **analytics** in milliseconds."

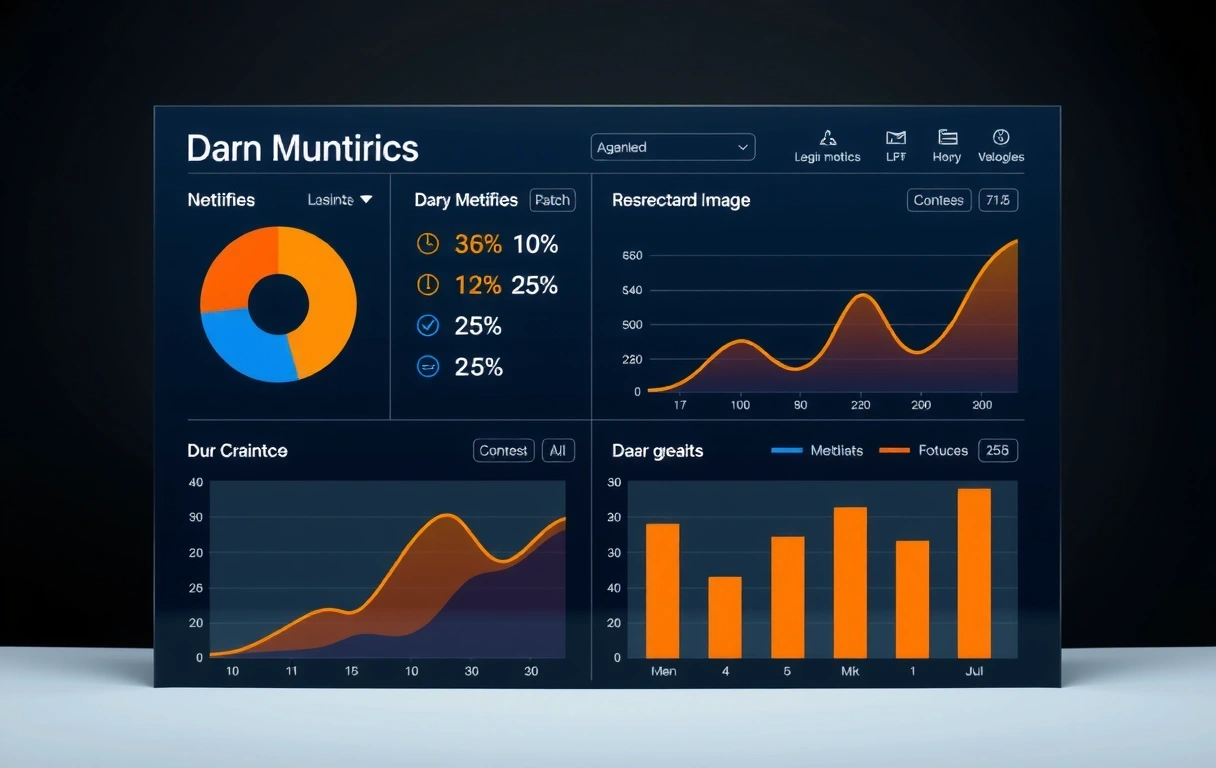
Visual Logic
Hierarchical data mapping visualized in real-time.
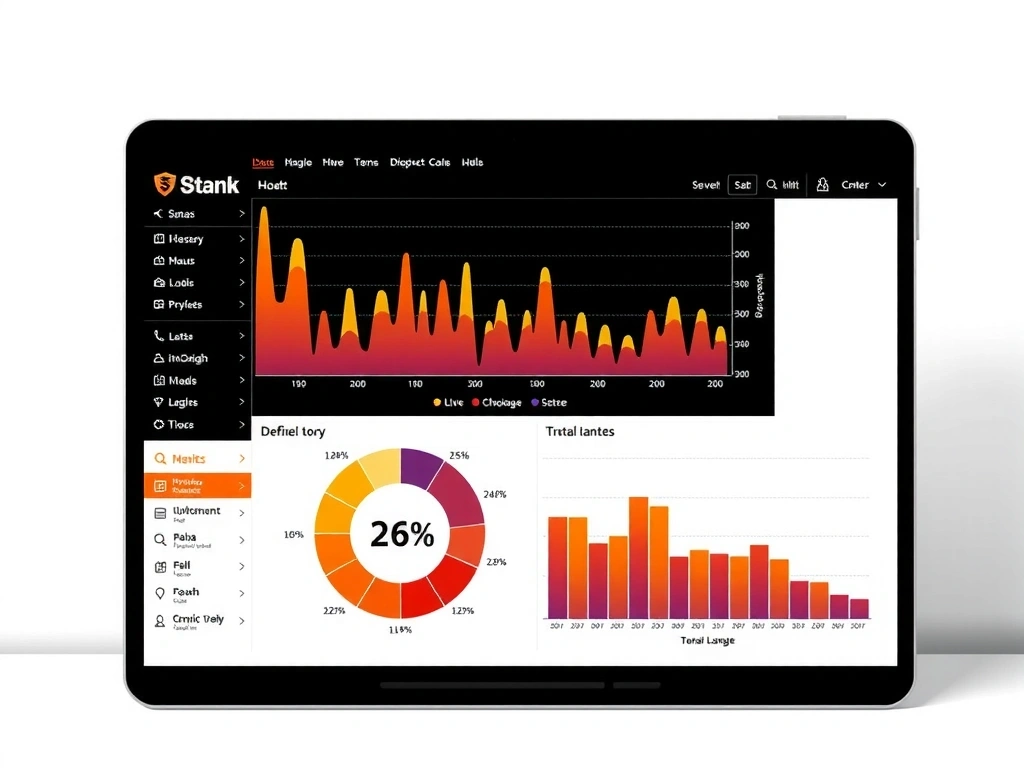
Client Implementation
By visualizing our cross-departmental **KPI** flow, the platform reduced reporting overhead by 40% in the first quarter.
Why Vantage Infrastructure?
Traditional dashboards are built on top of static databases. We built a platform on top of a live event stream.
Legacy BI Tools
-
Batch Processing
Data is updated in intervals (hourly/daily), leading to stale insights.
-
Siloed Metadata
Requires manual ETL (Extract, Transform, Load) processes for every new source.
-
Visual Noise
Complex charts that require specialized training to interpret.
The Vantage Platform
-
Stream-First Pipeline
Insights are reflected the moment the data packet arrival is confirmed.
-
Semantic Layer
Our engine automatically maps relationships between different business **metrics**.
-
Cognitive Design
Interfaces used by executives and analysts alike, with zero onboarding required.
Deployment Strategy
Transitioning to a high-speed **analytics** environment is a phased journey. We provide the blueprint for integration that minimizes disruption while maximizing data integrity.
Phase 01: Connect
Identify your core 5-10 high-impact **KPI** signals and connect through our universal API connector.
Phase 02: Scale
Roll out dashboard access to department heads, providing granular permission controls.
Phase 03: Automate
Configure anomaly detection alerts to receive mobile notifications before issues escalate.

Ready to see the difference?
Schedule a 15-minute walkthrough of the platform with our engineering lead.
Book a SessionSupport & Specs
Common technical inquiries regarding browser compatibility, data security, and platform limits.
Does it connect to my current CRM?
Yes. We support pre-built integrations for over 40+ enterprise platforms, including native support for SQL, Salesforce, and major cloud storage providers.
Is the mobile experience full-featured?
The mobile interface is optimized for tracking **metrics** and receiving alerts, while structural dashboard edits are best performed on the desktop browser.
How secure is the data transmission?
All data is encrypted in transit and at rest using AES-256 standards. Our local team in Istanbul 66 ensures all regional compliance standards are strictly met.
Can we white-label the dashboard?
Enterprise clients have access to our custom theme engine, allowing the entire interface to reflect internal company branding and color palettes.